irispy-lmsal documentation
irispy-lmsal is a Python package designed for the reading, manipulating and visualizing data taken with the Interface Region Imaging Spectrograph (IRIS).
What is IRIS?
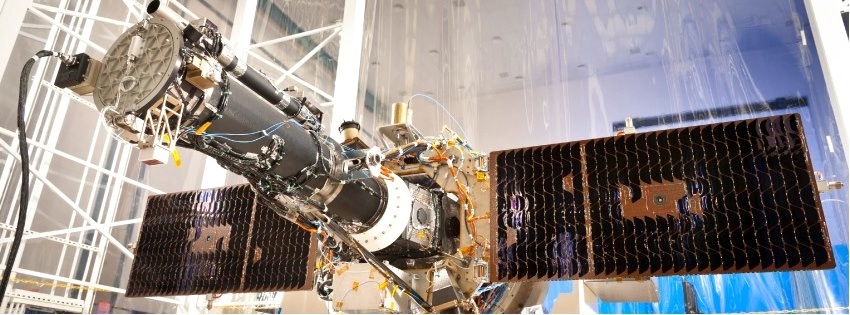
IRIS is satellite-borne solar scanning slit spectrograph, funded as part of NASA’s Small Explorer program and launched in June 2013. It provides simultaneous UV images and spectra of the regions between the visible surface of the Sun and its outer atmosphere (photosphere, chromosphere, transition region, and corona) with 0.33-0.4 arcsec spatial resolution, two-second temporal resolution and 1 km/s velocity resolution over a field-of-view of up to 175 arcsec x 175 arcsec. IRIS images are provided by its Slit-Jaw Imager (SJI) in four passbands: C II 1330 Å, Si IV 1400 Å, Mg II K 2796 Å and Mg II wing 2830 Å. If you desire more detail, the instrument paper PDF provides this.
As a scanning slit-spectrograph, IRIS disperses the sunlight by passing it through a narrow slit and onto a CCD. The spectrograph can operate in two basic modes: sit-and-stare, where the slit is aligned with a single position on the Sun; and raster, where the slit moves sequentially across the Sun perpendicular to the long axis of the slit in a pre-determined number of steps and step size. When the last position is reached, the slit returns to the origin position and starts again. IRIS is has many different observing programs involving different numbers of raster steps, step sizes, exposure times, etc., making it a powerful and flexible tool for solar physics.
The complexity of IRIS leads to a variety of different data products with different dimensionalities and ways in which they are used by scientists. Therefore a powerful, yet flexible suite of data analysis tools is required to enable users to efficiently, reliably and effectively pursue their science goals. This is the aim of irispy-lmsal.
What is irispy-lmsal?
irispy-lmsal is a open-source Python package that provides tools to read, manipulate and visualize IRIS data.
It provides a set of classes for handling both SJI and spectrograph observations.
These link the observations with various forms of supporting data including: measurement uncertainties; units; a data mask to mark pixels with unreliable or unphysical data values; WCS (World Coordinate System) transformations that describe the position, wavelengths and times represented by the pixels; and general metadata.
These classes also provide methods for applying a number of calibration routines including exposure time correction and conversion between data number, photons, and energy units.
irispy-lmsal classes inherit more fundamental functionality from the sunraster package.
A powerful, generic slicing API (application programmable interface) allows users to manipulate the same data object as if it were 3D (time, latitude, wavelength) or 4D (raster
number, longitude, latitude, wavelength), which is very useful dealing with scanning slit-spectrograph data.
The API simultaneously slices not only the data, but the uncertainties, data mask, and WCS transformations leading to faster and less error-prone data analysis.
The irispy-lmsal classes also inherit the ability to crop by real world coordinates, useful when locating a region of interest using information from other observatories, and a visualization suite which allows users to easily and intuitively visually inspect their data.
Getting help
If you would like to get into touch with someone who works on irispy-lmsal for any reason, we suggest
opening an issue on the irispy-lmsal GitLab issue tracker.
If you would rather not register to use GitLab, you can email freij@baeri.org directly.